Skip to content

15 Customer Support KPIs Every Enterprise Team Should Measure in 2026

15 Customer Support KPIs Every Enterprise Team Should Measure in 2026

Customer expectations continue to rise across every support channel.

Faster responses, personalized interactions, and seamless issue resolution now influence retention, customer loyalty, and brand perception at scale.

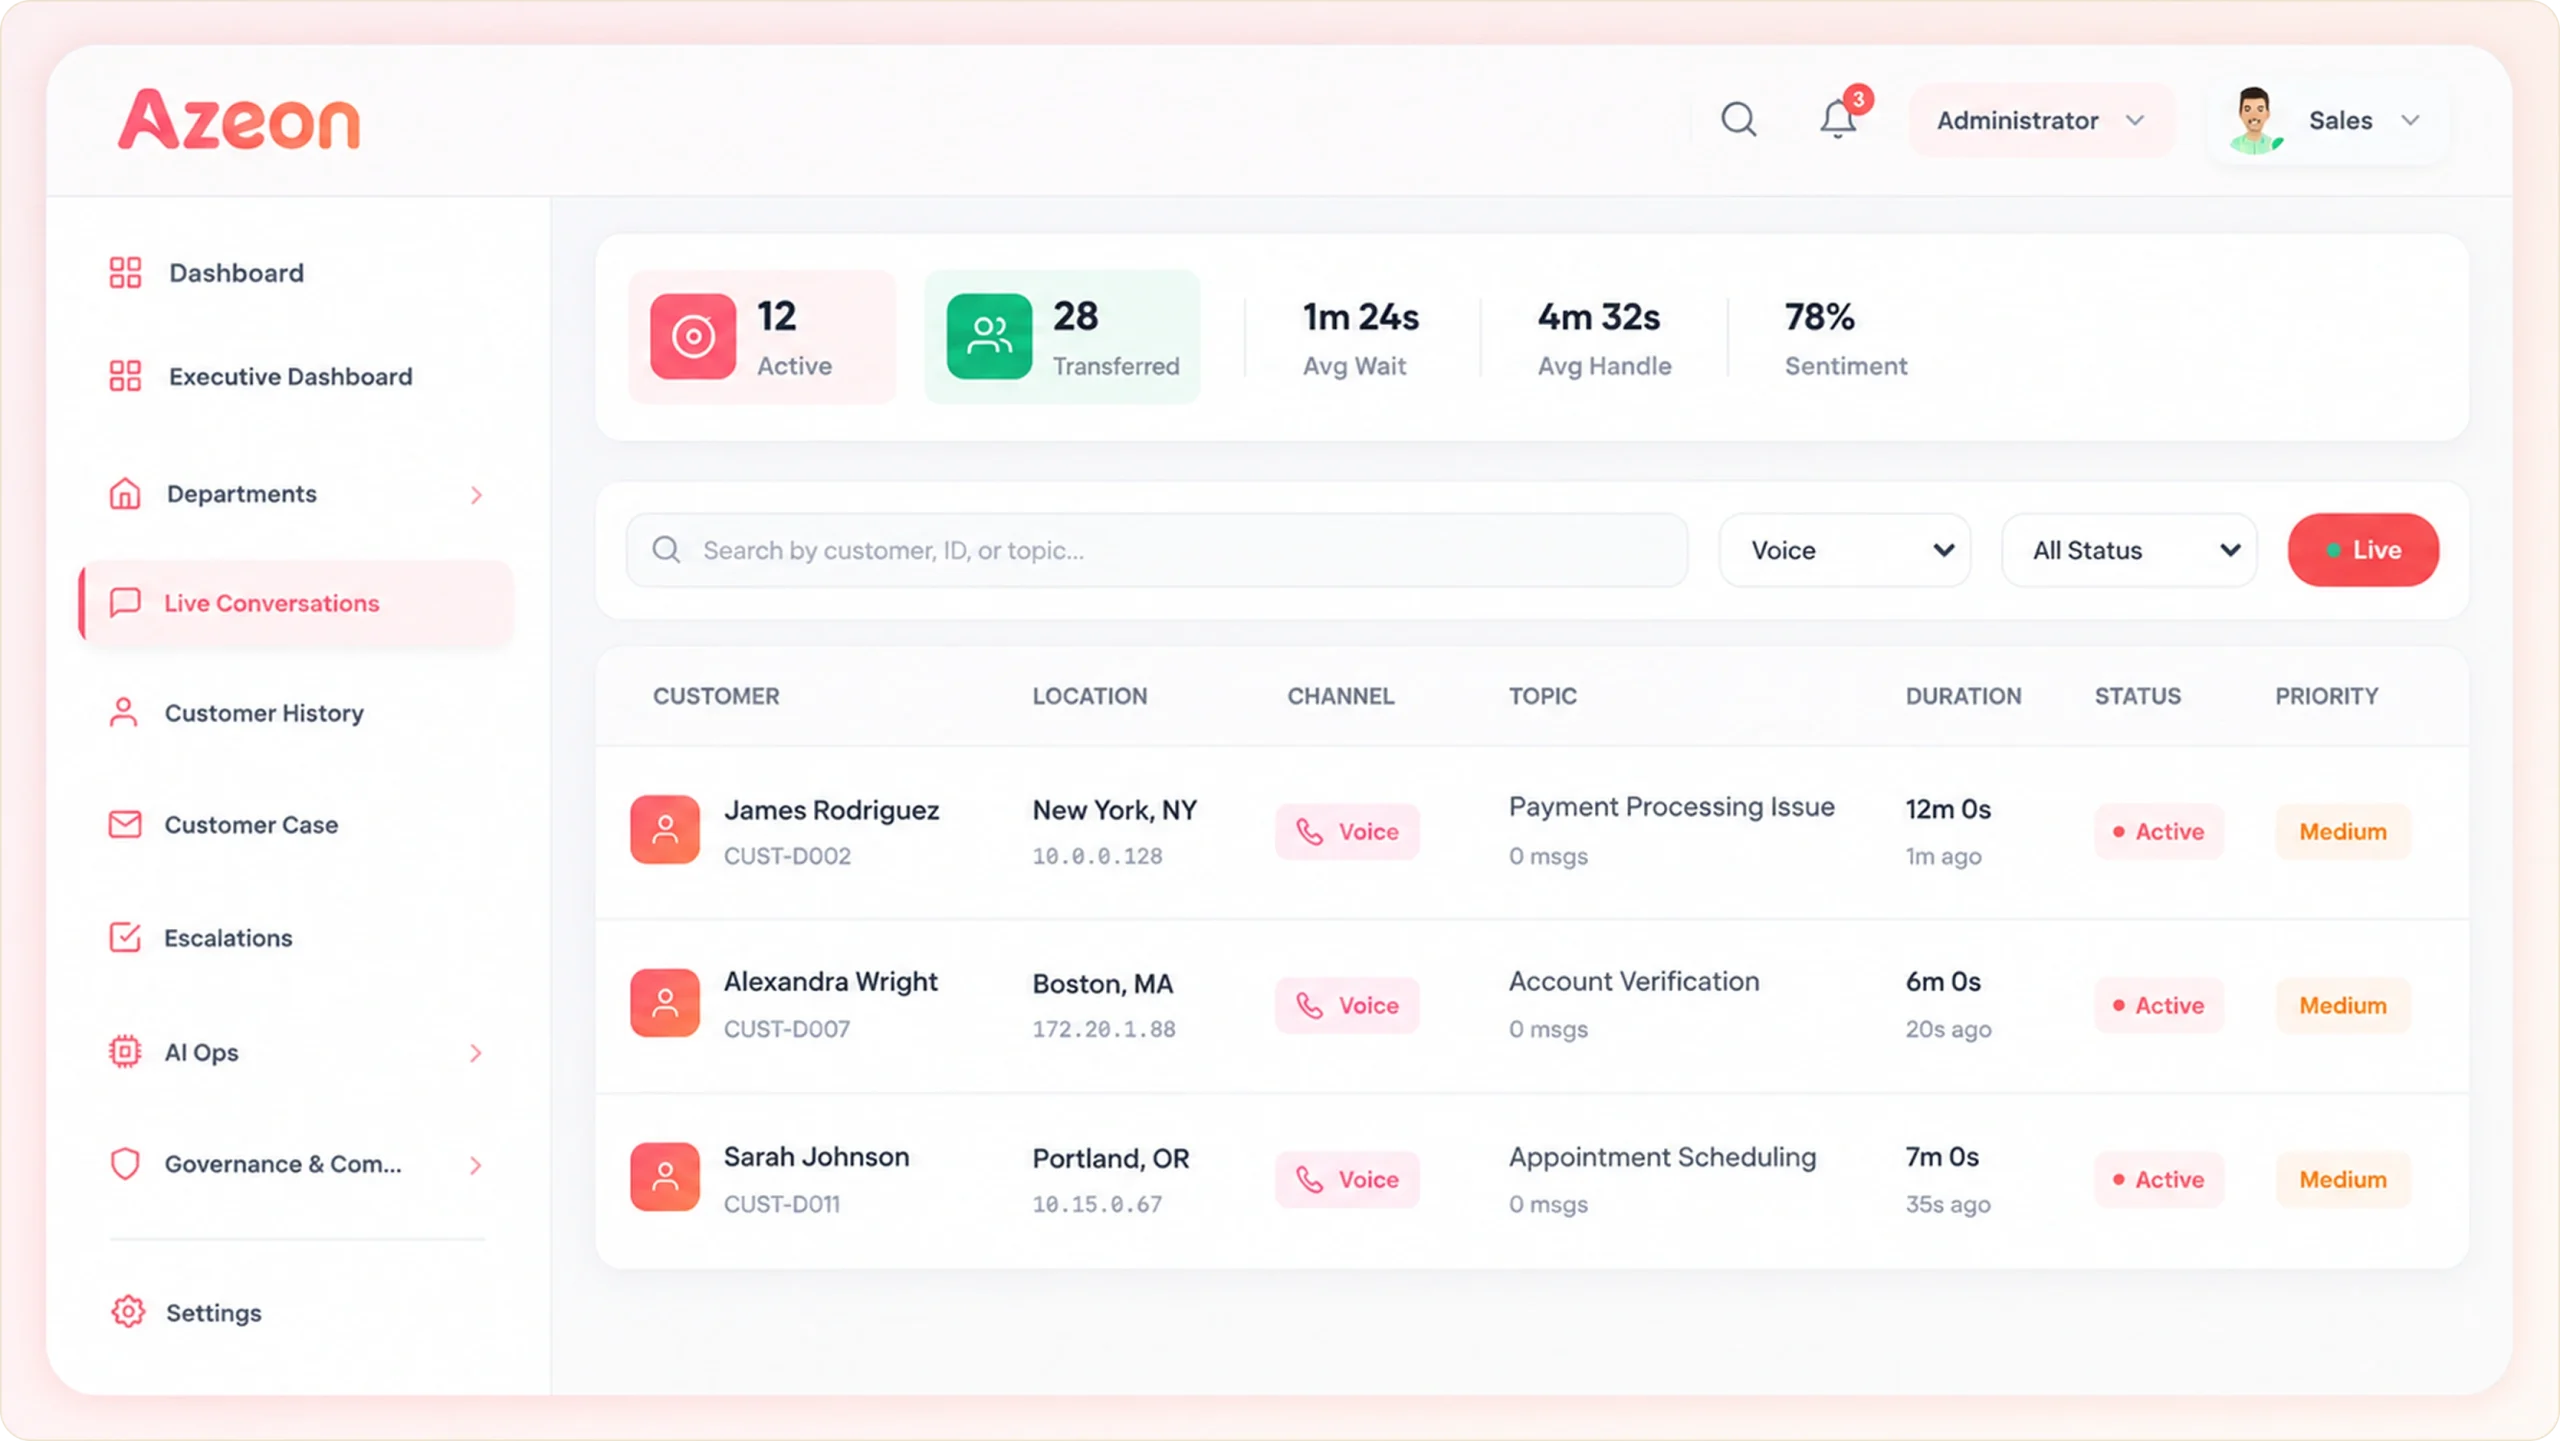
At the same time, support organizations are managing growing ticket volumes, AI-driven workflows, complex SLAs, and omnichannel operations.

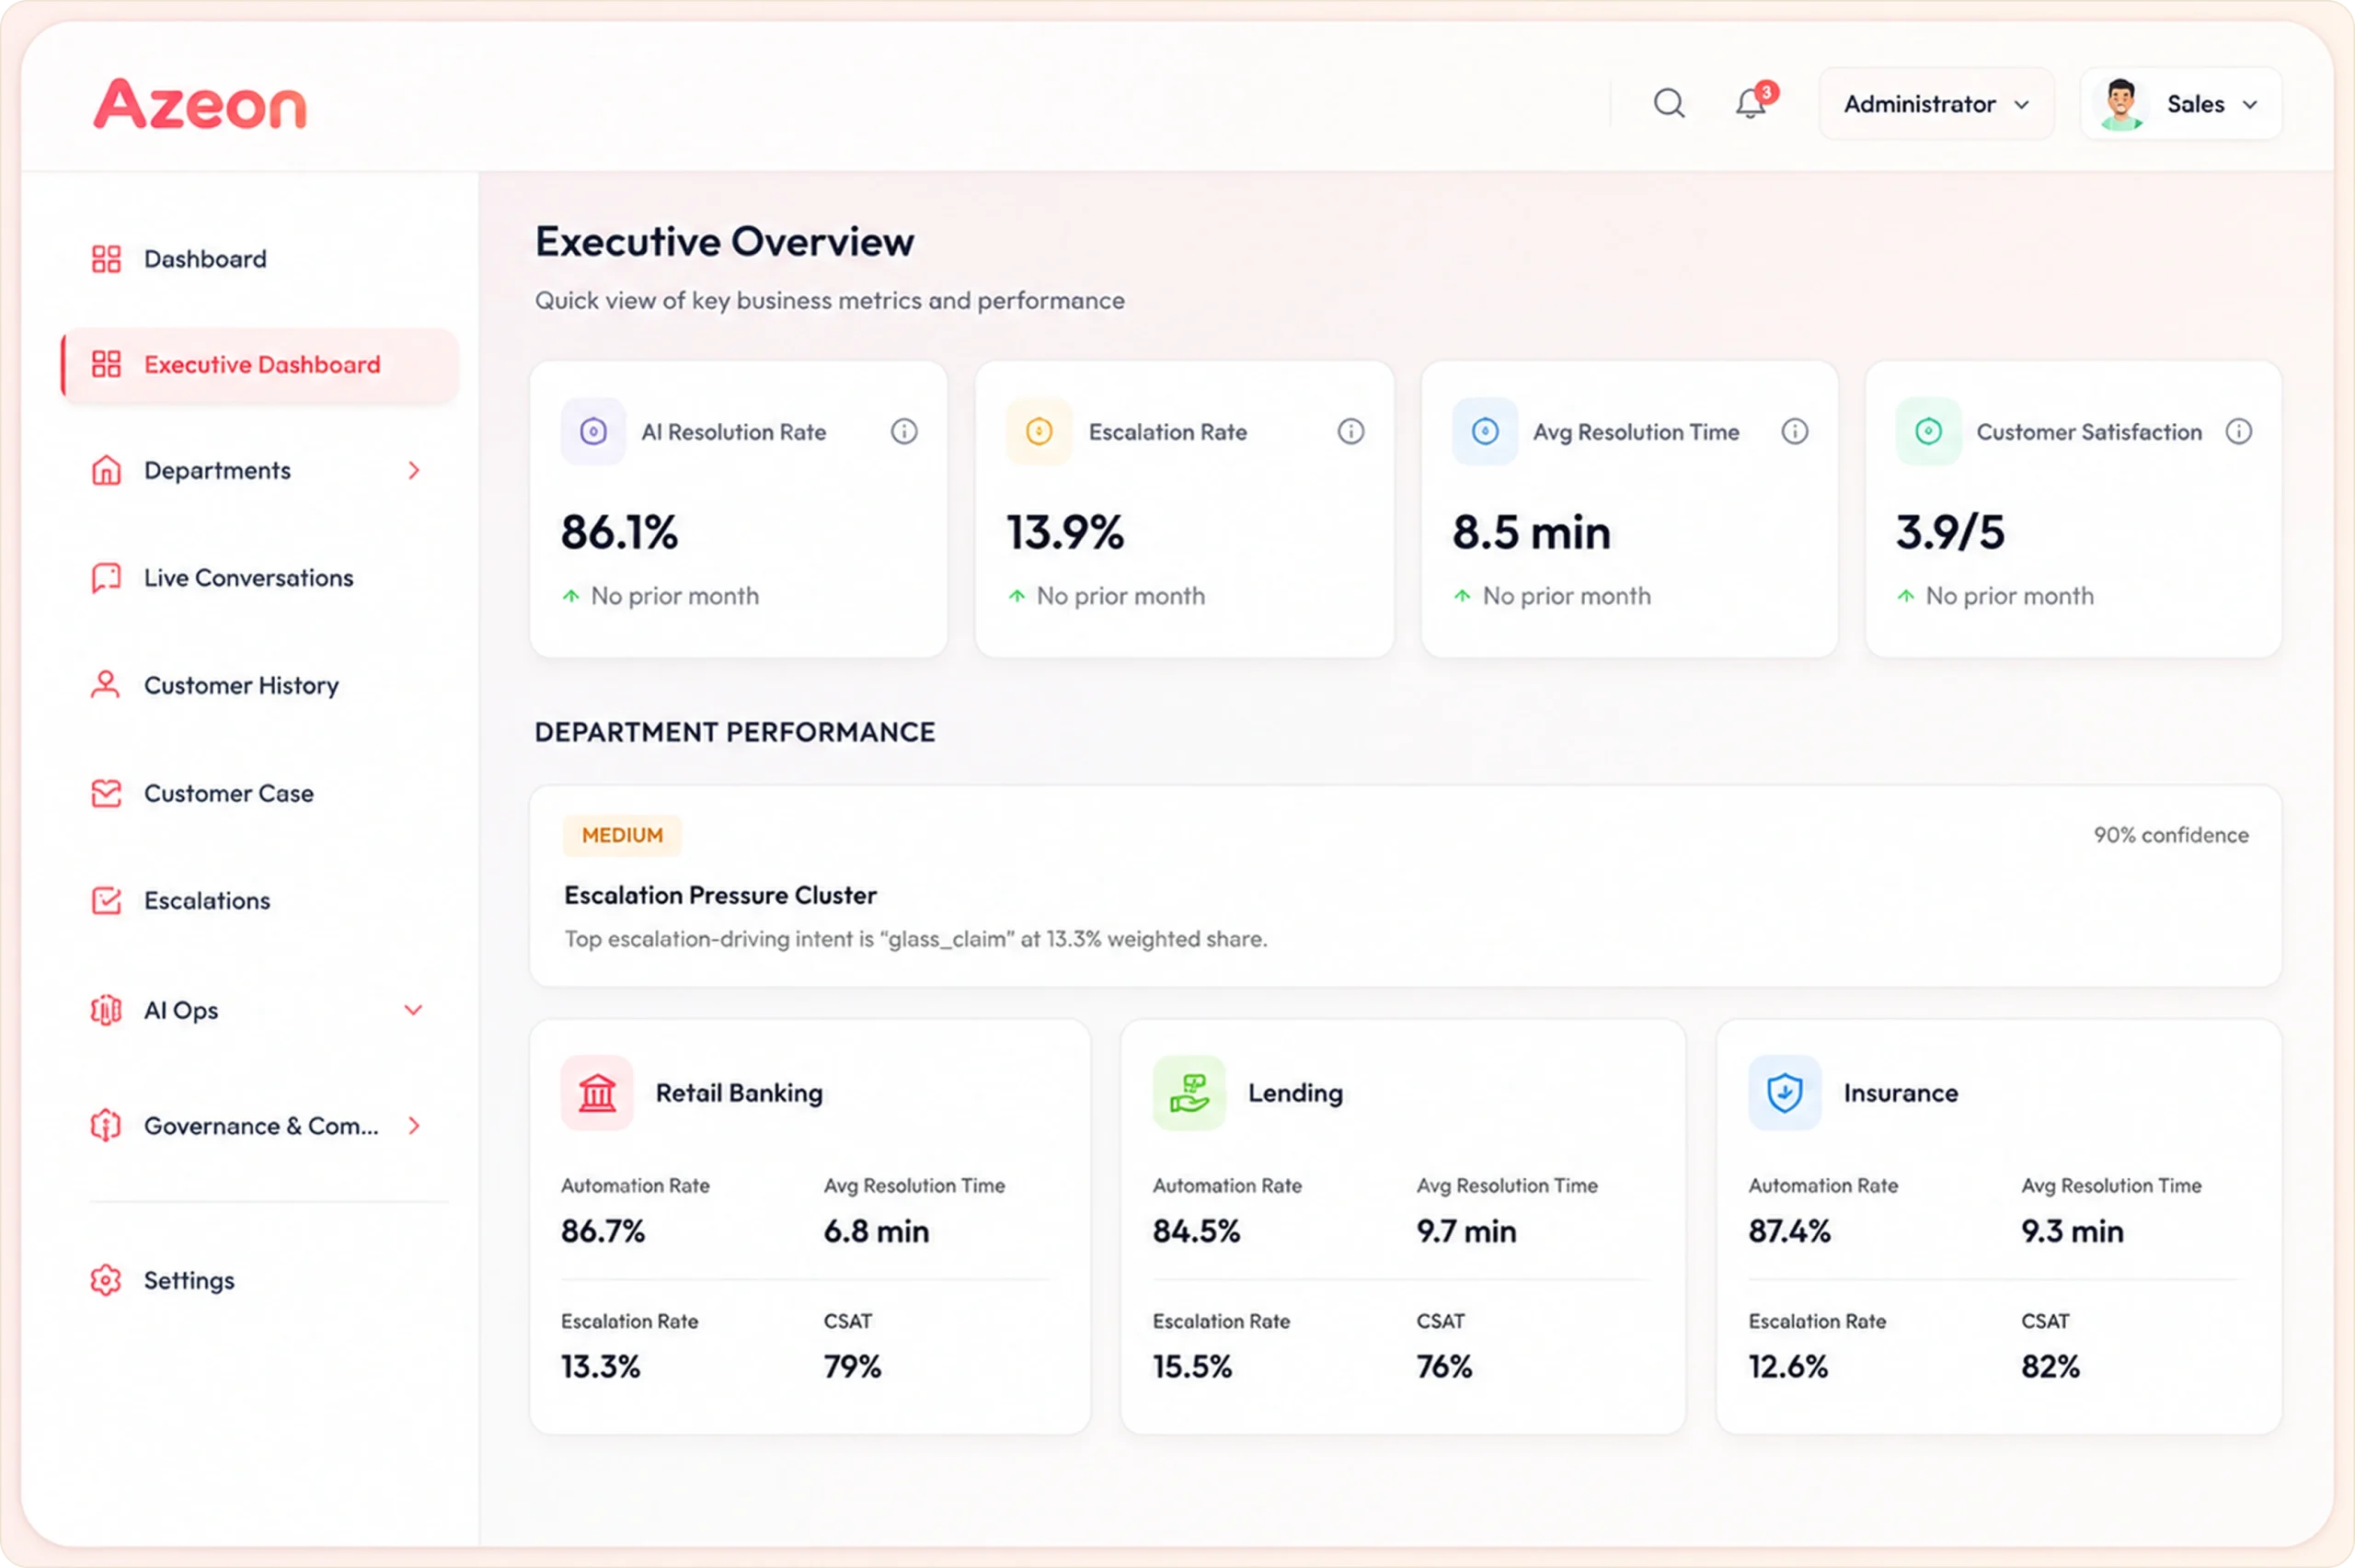
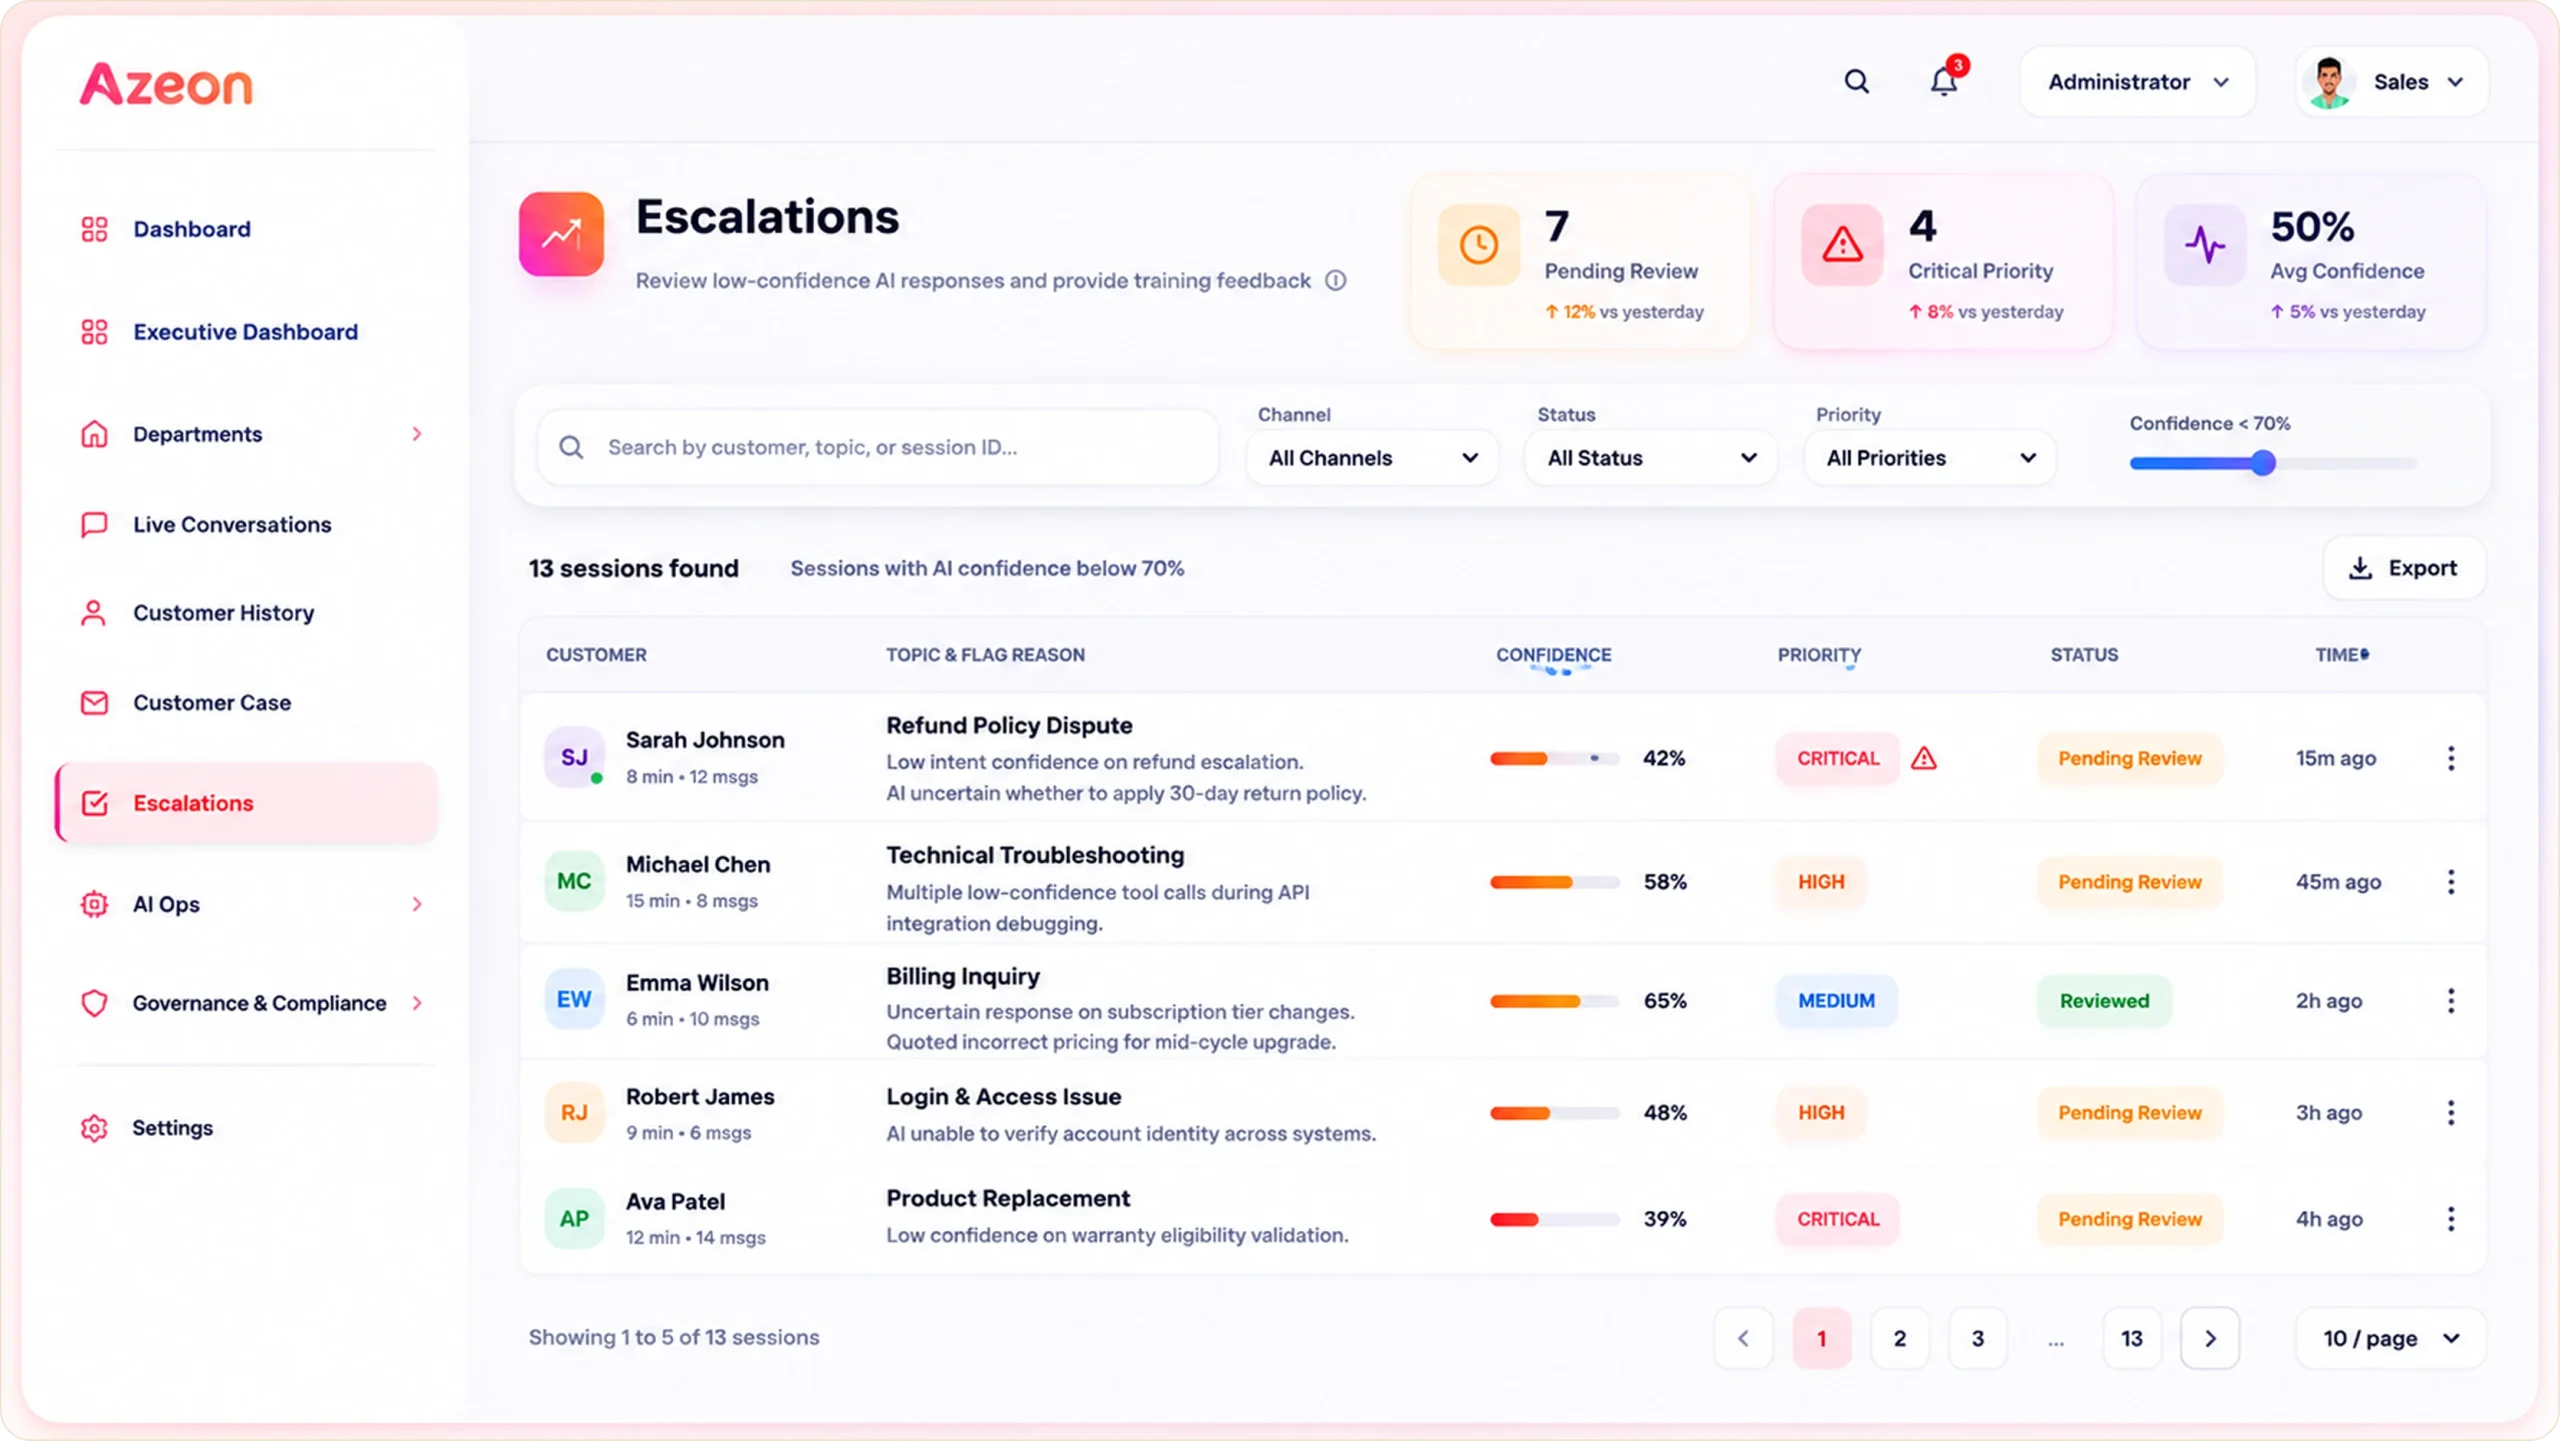
Support teams need more than visibility into ticket activity. They need KPIs that reveal operational health, customer experience quality, and automation performance in real time.

This guide covers 15 customer support KPIs enterprise teams should track to build faster, smarter, and more scalable support operations.

15 Customer Support KPIs to Track in 2026

Track the customer support metrics that improve operational efficiency, customer satisfaction, AI performance, and SLA compliance across modern support teams.

01

First Response Time (FRT)

What It Measures

The average time it takes for a customer to receive the first reply after submitting a support request.

Why It Matters

Fast acknowledgment builds customer confidence immediately and reduces escalation risks.

Common Benchmark

Under one hour for high-priority support channels.

First Response Time = Total First Response Time ÷ Total Tickets
02

Average Resolution Time

What It Measures

The total time required to fully resolve a customer issue.

Why It Matters

Resolution time reflects operational efficiency and workflow quality.

Common Benchmark

Enterprise teams often target resolution within 24 hours.

Average Resolution Time = Total Resolution Time ÷ Resolved Tickets
03

First Contact Resolution (FCR)

What It Measures

The percentage of issues resolved during the first interaction.

Why It Matters

High FCR improves customer satisfaction while reducing support workload.

Common Benchmark

70% to 85% for high-performing enterprise teams.

FCR = (First Contact Resolutions ÷ Total Tickets) × 100
04

Customer Satisfaction Score (CSAT)

What It Measures

Customer satisfaction immediately after a support interaction.

Why It Matters

CSAT provides direct insight into perceived support quality.

Common Benchmark

85% or higher for enterprise support operations.

CSAT = (Positive Responses ÷ Total Responses) × 100
05

Net Promoter Score (NPS)

What It Measures

Customer willingness to recommend a company or service.

Why It Matters

NPS connects support quality with long-term customer loyalty.

Common Benchmark

A score above 40 is considered strong.

06

Customer Effort Score (CES)

What It Measures

How easy it was for customers to get their issue resolved.

Why It Matters

Lower effort experiences often lead to stronger retention outcomes.

Common Benchmark

Teams aim to minimize customer effort.

07

SLA Compliance Rate

What It Measures

The percentage of tickets resolved within SLA targets.

Why It Matters

SLA compliance reflects operational discipline and service reliability.

Common Benchmark

90% or higher SLA adherence.

SLA Compliance = (Tickets Within SLA ÷ Total Tickets) × 100
08

Ticket Backlog Volume

What It Measures

The number of unresolved or pending support tickets.

Why It Matters

Growing backlogs often signal workflow inefficiencies.

Common Benchmark

High-performing teams maintain manageable backlog levels.

09

Average Handle Time (AHT)

What It Measures

The average time agents spend managing customer interactions.

Why It Matters

AHT helps evaluate operational efficiency while balancing support quality.

Common Benchmark

Benchmarks vary based on industry complexity.

AHT = Total Handling Time ÷ Total Interactions
10

AI Containment Rate

What It Measures

The percentage of customer issues fully resolved by AI systems.

Why It Matters

Strong containment rates indicate scalable support automation.

Common Benchmark

50% to 80% depending on support complexity.

AI Containment Rate = (AI-Resolved Conversations ÷ Total AI Conversations) × 100
11

AI Escalation Rate

What It Measures

The percentage of AI conversations transferred to human agents.

Why It Matters

Escalation patterns reveal automation gaps and workflow friction.

Common Benchmark

Lower escalation rates indicate stronger automation performance.

12

Automation Accuracy

What It Measures

How accurately AI systems classify, route, and resolve requests.

Why It Matters

Automation quality directly influences customer trust.

Common Benchmark

Enterprise teams continuously monitor automation accuracy.

13

Human Handoff Success Rate

What It Measures

How effectively AI conversations transition to human agents.

Why It Matters

Strong handoffs preserve conversation context and reduce friction.

14

Agent Productivity

What It Measures

The volume of resolved tickets managed by each support agent.

Why It Matters

Productivity metrics help teams optimize staffing and workflows.

Agent Productivity = Resolved Tickets ÷ Total Agents
15

QA Score

What It Measures

The quality of support interactions based on review standards.

Why It Matters

QA scoring helps maintain consistency and service quality.

Common Benchmark

High-performing organizations often target QA scores above 90%.

Key Takeaway for Support Leaders

The most effective support teams rarely focus on a single metric. They balance customer experience, operational efficiency, and AI performance to create a complete view of support health. Tracking KPIs such as CSAT, First Contact Resolution, SLA Compliance, and AI Containment Rate together helps teams identify opportunities for continuous improvement rather than isolated wins.

Customer Support KPI Template to Run Smarter Operations

A structured KPI model for tracking support performance, customer outcomes, and AI support efficiency at scale.

KPI What It Measures Suggested Benchmark
First Response Time Speed of first customer reply Under 1 hour
Average Resolution Time Time to fully resolve issues Under 24 hours
First Contact Resolution Issues solved in the first interaction 70–85%
CSAT Customer satisfaction level 85%+
NPS Customer loyalty and advocacy 40+
CES Ease of support experience Low effort
SLA Compliance Resolution within SLA targets 90%+
Ticket Backlog Pending unresolved tickets Minimized
Average Handle Time Agent interaction duration Industry dependent
AI Containment Rate AI-only resolutions 50–80%
AI Escalation Rate AI-to-human transfers Optimized continuously
Automation Accuracy AI routing and resolution quality High accuracy
Human Handoff Success Smooth escalation workflows Strong continuity
Agent Productivity Ticket resolution output Balanced efficiency
QA Score Support interaction quality 90%+

Common Mistakes Teams Make When Tracking Customer Support KPIs

Many support organizations collect large volumes of support data without connecting metrics to operational outcomes.

Some of the most common mistakes include:

Customer Support KPIs Tracking Mistakes

1. Focusing Only on Speed Metrics

Fast responses matter, though speed alone does not guarantee customer satisfaction. 

2. Ignoring AI Quality Metrics

AI containment without automation accuracy creates inconsistent customer experiences.

3. Tracking Too Many KPIs

Too many disconnected metrics create reporting complexity without operational clarity.

4. Separating AI and Human Support Analytics

Modern support operations require unified visibility across automation and human workflows.

5. Missing Customer Effort Signals

Customers often value simplicity and issue resolution quality more than response speed alone.

Customer Support KPIs Are Only Valuable When They Drive Action

The purpose of KPI tracking isn't reporting performance. It's identifying where customer experience, support operations, and automation can improve.

How Azeon Helps Enterprises Track and Improve Customer Support KPIs

Azeon is an Agentic AI-powered customer support intelligence platform that helps enterprises monitor support operations, uncover performance bottlenecks, and continuously improve customer experience.

By combining KPI visibility, live conversation monitoring, and AI governance in a single environment, Azeon enables teams to move from reporting metrics to acting on them.

Start with Executive-Level KPI Visibility

With Azeon’s Executive Dashboard, teams can monitor critical customer support KPIs such as AI Resolution Rate, Escalation Rate, Average Resolution Time, Customer Satisfaction, and department-level performance from a single view.

Azeon Executive Dashboard

Rather than spending time compiling reports across multiple systems, support leaders can instantly identify performance trends, benchmark departments, and uncover areas that require attention.

See Customer Support Performance in Motion

With Azeon’s Live Conversations workspace, support leaders gain visibility into ongoing customer engagements across channels.

Teams can monitor active sessions, track wait times, identify transfer patterns, and understand how support interactions are progressing in real time.

Track Live Conversations

Surface Escalation Risks Before They Become Service Issues

Azeon’s Escalations workspace highlights low-confidence AI interactions, critical customer issues, and conversations that require human review.

Teams can quickly identify patterns, investigate recurring problems, and improve automation performance through continuous feedback.

Manage Escalations

Turn KPI Reporting Into Continuous Improvement

The most effective support organizations don’t just measure KPIs – they use them to improve operations.

Azeon helps enterprises connect executive reporting, live customer interactions, and escalation intelligence in one platform.

Whether the goal is improving CSAT, reducing resolution times, increasing AI containment rates, or strengthening support efficiency, Azeon provides the visibility needed to drive measurable improvements across customer support operations.

David Pridgen
David Pridgen
National Account Manager

From KPI Tracking to Operational Excellence.

Explore how Azeon helps support teams improve customer satisfaction, reduce escalations, and increase automation performance.

Book a Personalized Demo →

FAQs: Customer Support KPIs

What are customer support KPIs?

Customer support KPIs are measurable metrics used to evaluate the efficiency, quality, and performance of customer support operations. Businesses use customer support KPIs to track response times, customer satisfaction, SLA compliance, and issue resolution effectiveness. These metrics help support teams improve operational visibility and customer experience.

Which customer support KPIs matter most for enterprise teams?

Some of the most important customer support KPIs include First Response Time (FRT), Customer Satisfaction Score (CSAT), First Contact Resolution (FCR), SLA Compliance Rate, and AI Containment Rate. Enterprise support teams also monitor escalation rates, automation accuracy, and customer effort scores to improve service quality and operational efficiency.

What is a customer support KPI template?

A customer support KPI template is a structured framework used to track support performance metrics in one place. It helps organizations monitor customer support metrics such as response times, ticket resolution rates, customer satisfaction, and AI support performance. Many enterprise teams use KPI templates for reporting dashboards and operational reviews.

How do enterprises measure customer support performance?

Enterprises measure customer support performance using a combination of operational, customer experience, and AI support metrics. Common customer service KPIs include CSAT, average resolution time, ticket backlog, SLA compliance, and support automation metrics. These KPIs provide visibility into both customer outcomes and internal support efficiency.

How often should customer support KPIs be reviewed?

Most enterprise teams review customer support KPIs weekly for operational monitoring and monthly for strategic performance analysis. Frequent KPI reviews help organizations identify support bottlenecks, improve SLA compliance, and optimize AI-driven customer support workflows.

Glossary

1. Customer Support KPIs: Customer Support KPIs are measurable metrics used to evaluate the performance, efficiency, and quality of customer support operations.

2. Customer Support Metrics: Customer Support Metrics are data points used to analyze customer service performance and operational effectiveness.

3. First Contact Resolution (FCR): First Contact Resolution (FCR) measures the percentage of customer issues resolved during the first interaction without follow-ups or escalations.

4. Customer Satisfaction Score (CSAT): Customer Satisfaction Score (CSAT) is a customer support KPI used to measure how satisfied customers are after a support interaction.

5. AI Containment Rate: AI Containment Rate measures the percentage of customer conversations fully resolved by AI without requiring human agent involvement.

David works closely with enterprise organizations to help them modernize customer support operations through AI-driven automation. With experience in strategic account management, customer engagement, and technology consulting, David focuses on aligning business objectives with scalable support solutions that improve efficiency, customer experience, and operational performance.

David Pridgen
National Account Manager

Questions about Azeon?

Connect with our team to explore use cases, workflows, and deployment possibilities.